
March 1, 2023
Aman Sharma is a former Microsoft employee, a current Microsoft MVP, and a Principal Technical Consultant at Green House Data. Connect with him on LinkedIn or Twitter and be sure to follow his personal blog.
Azure Sentinel is Microsoft's cloud-native SIEM (Security Information and Event Management) service with built-in AI analytics. It reduces the cost and complexity to provide a single pane of glass to get central and near real-time view of your whole environment.
Threats related to infrastructure, networking, users, and applications can be monitored via Azure Sentinel. As a cloud-native service, it scales as per your needs. It collates the data from your environment on-premises, in Azure, and any third party cloud providers. It uses Microsoft Threat Intelligence to analyze all the signals and filters out the noise from actual relevant alerts.
This two part blog series will introduce you to Azure Sentinel and show you how to get set up with the service and start exploring its many features.
Azure Sentinel drills through all the incoming data and forms analysis based on different known patterns like anomalous logins. It ensures that you get a view of all the relevant security information that requires your immediate attention. The key pieces of information that you get right away are:
Azure Sentinel works with the Log Analytics workspace. You can reuse one of the existing workspaces or create a new one.
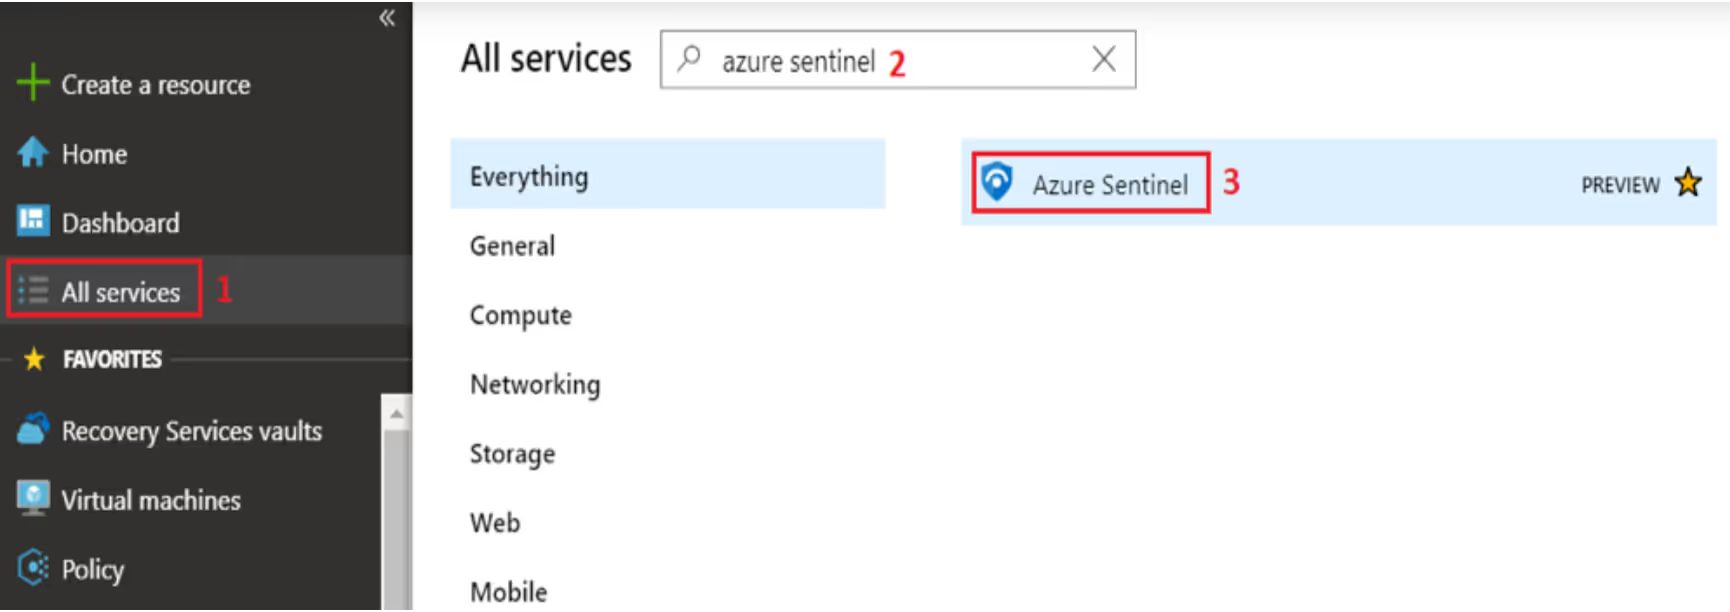
To start working with Azure Sentinel, launch the service by:
As mentioned before, you need a Log Analytics workspace to work with Azure Sentinel. You can either:
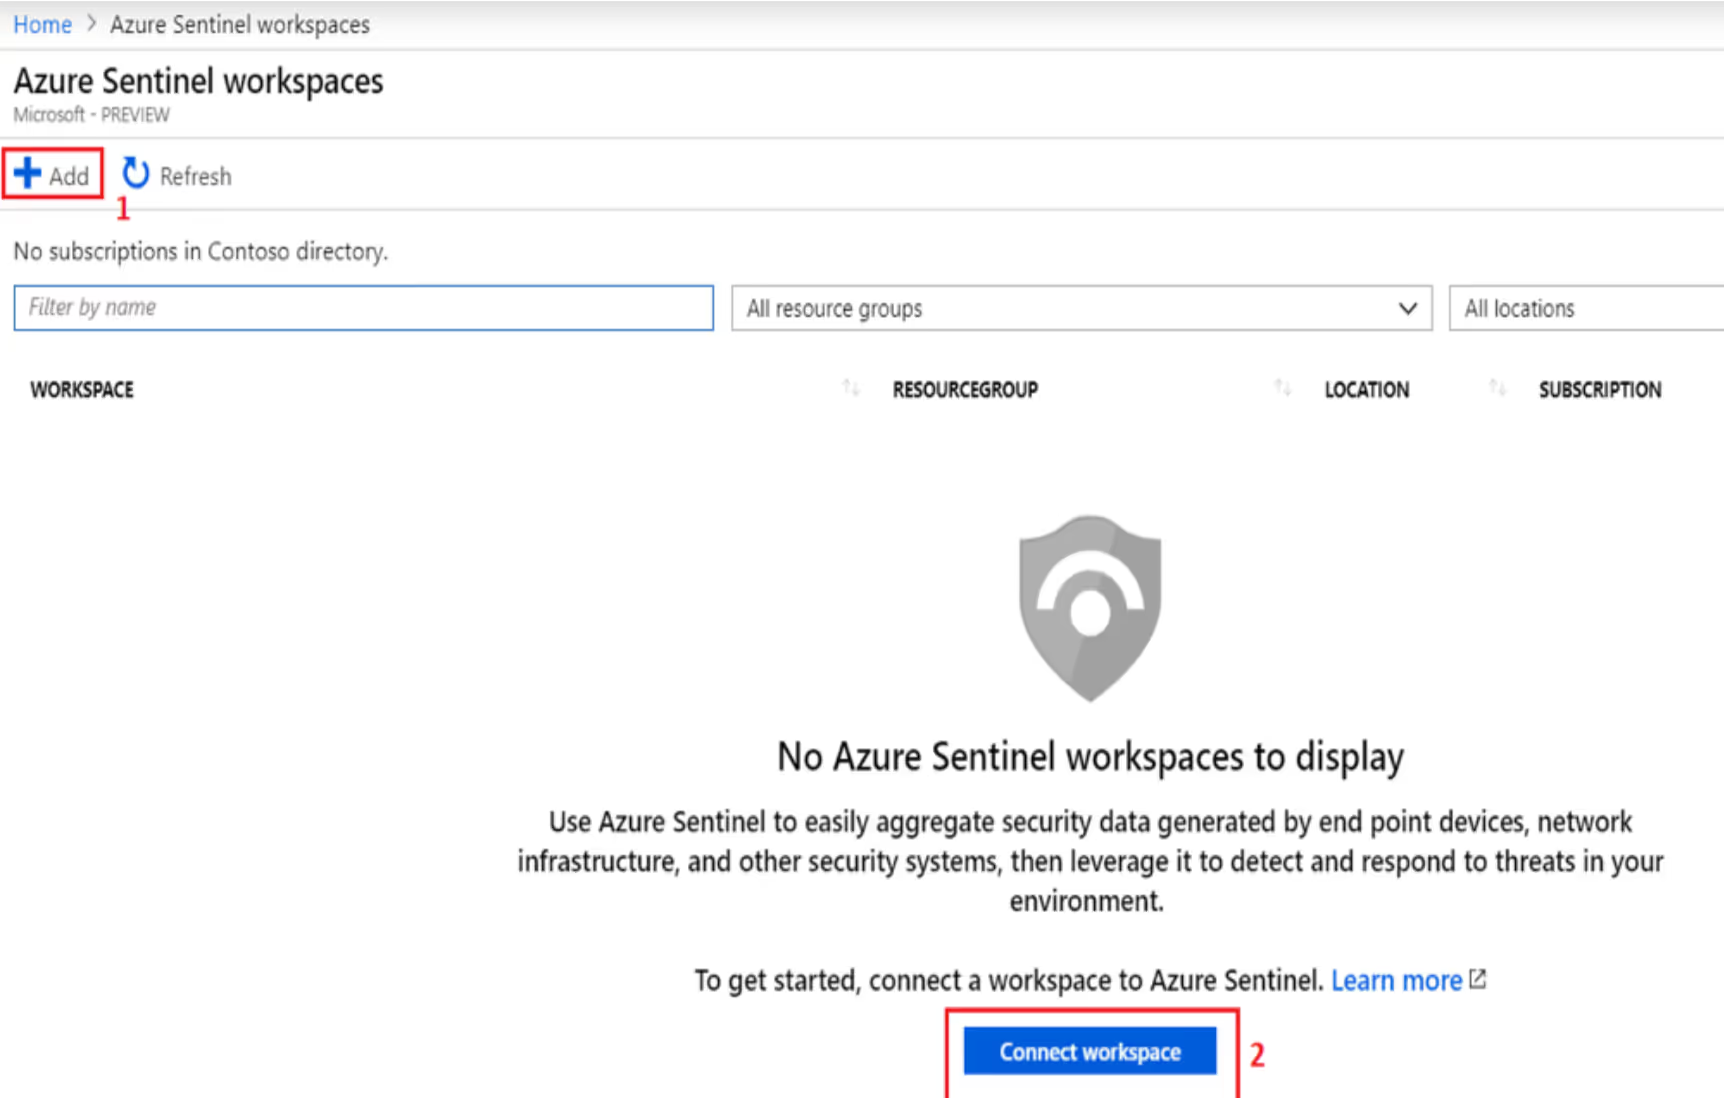
As soon as you create (or connect) a workspace, you will want to connect your data sources. You can do so from the "Data connectors" option under the Configuration settings.
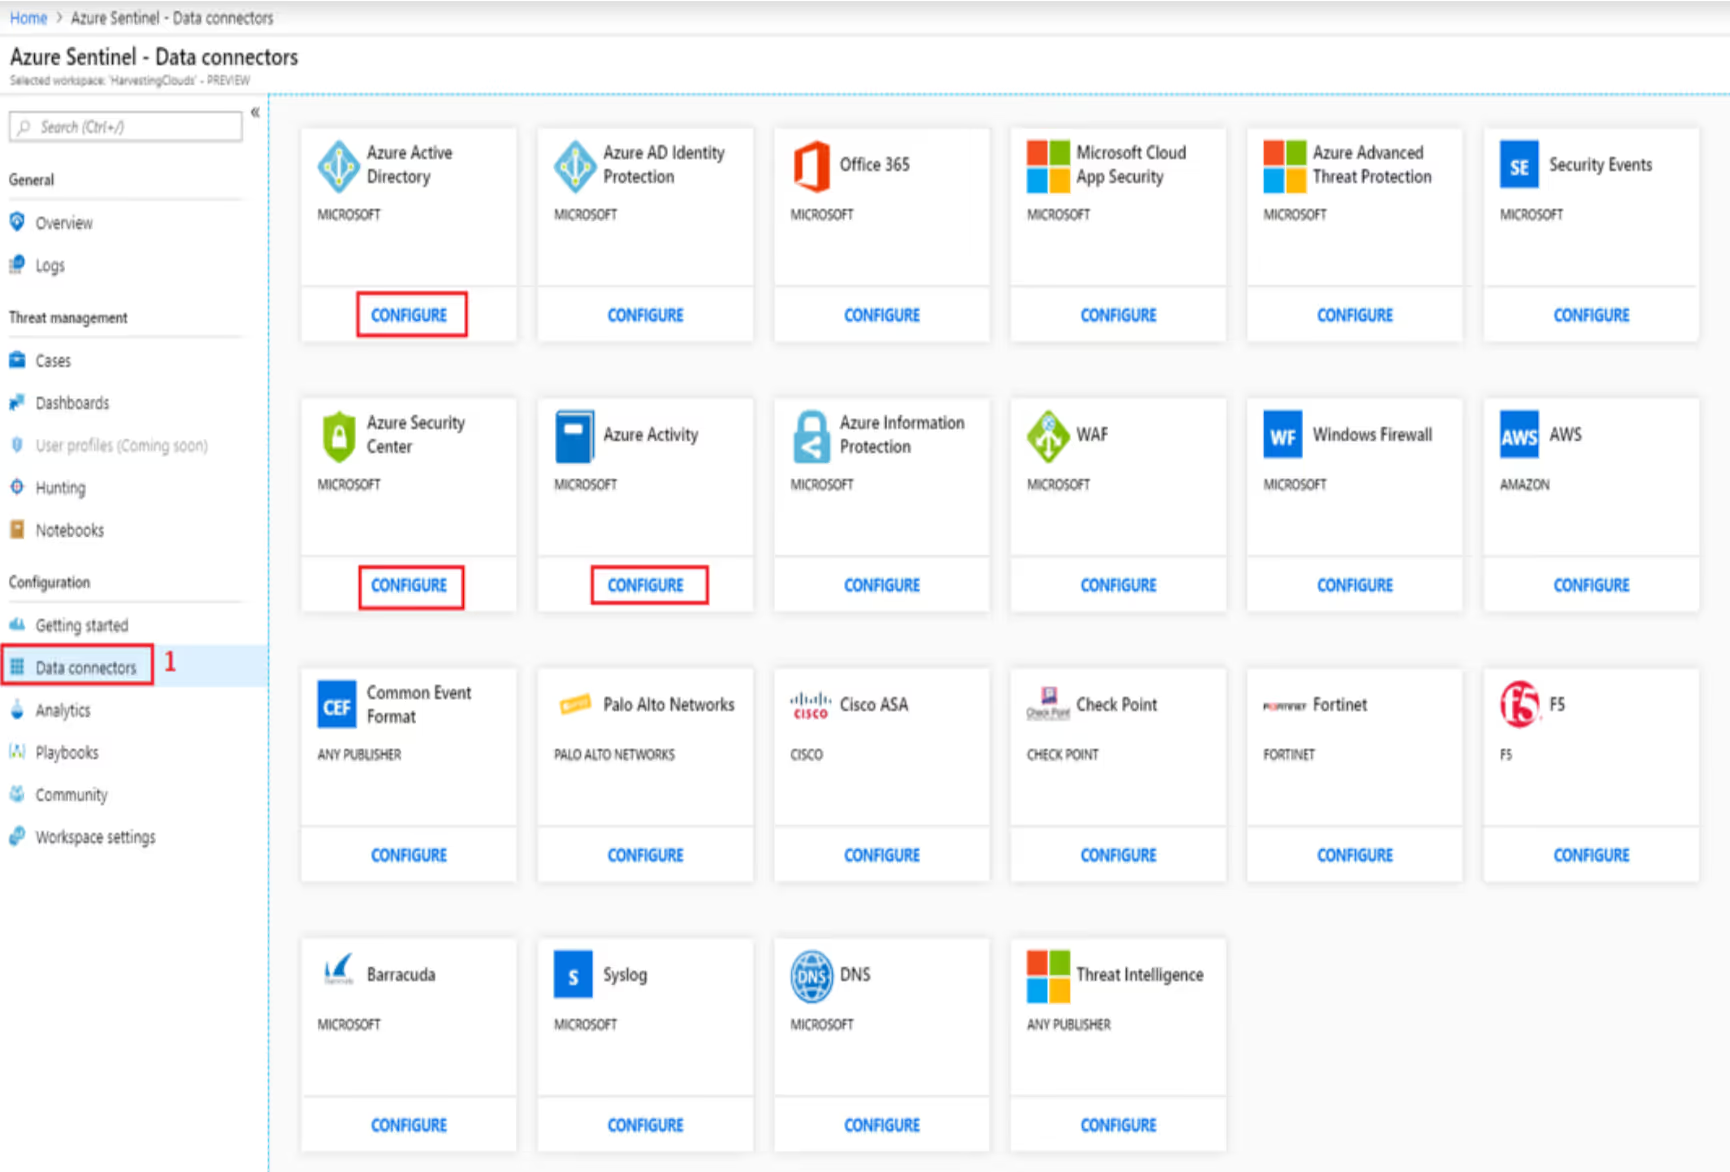
Click on "Configure" for all the data sources you want Sentinel to import data from. You should select as many as you can as long as they are relevant to your environment. There are connectors not just from Microsoft, but also from third party providers like Palo Alto, Check Point, F5, Barracuda, Cisco ASA, and Fortinet, to name just a few.
Every configuration wizard has different settings. Here is the one for Azure AD. You can configure Sentinel to connect the Sign-in logs and Audit logs from Azure AD.
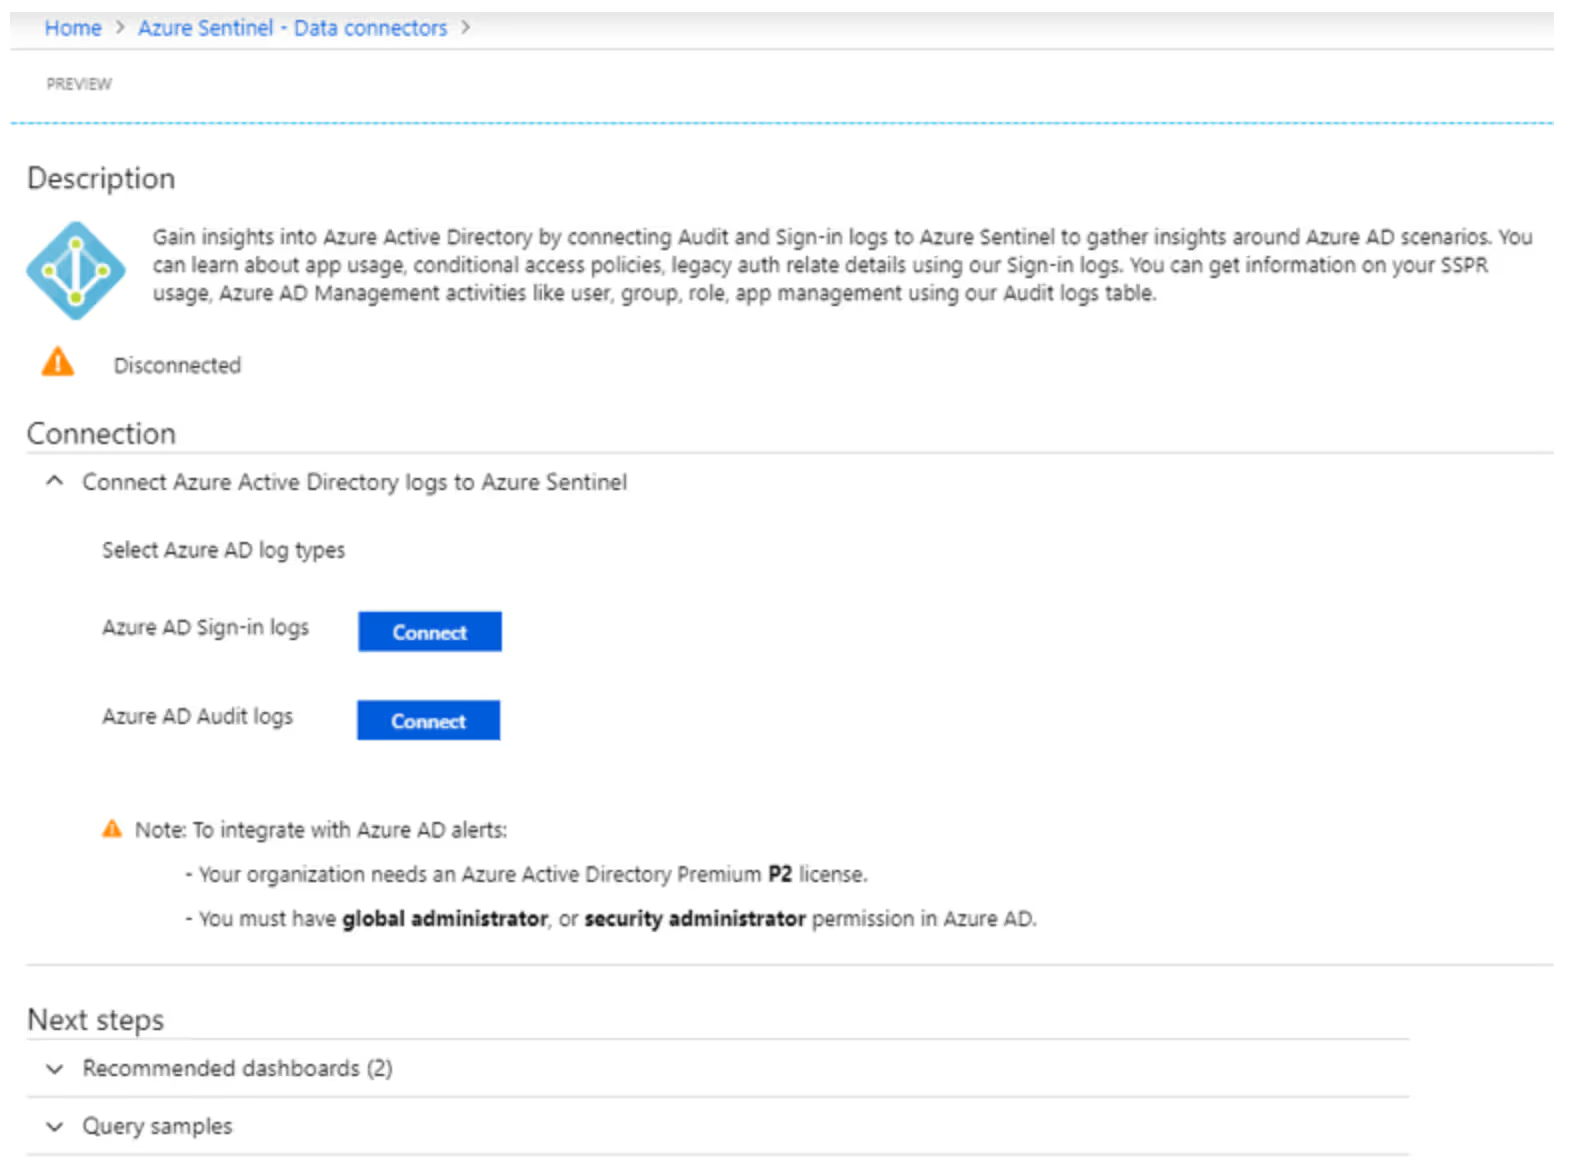
Note that to integrate with Azure AD alerts:
When you start, your Azure Sentinel dashboard will look something like the below image.
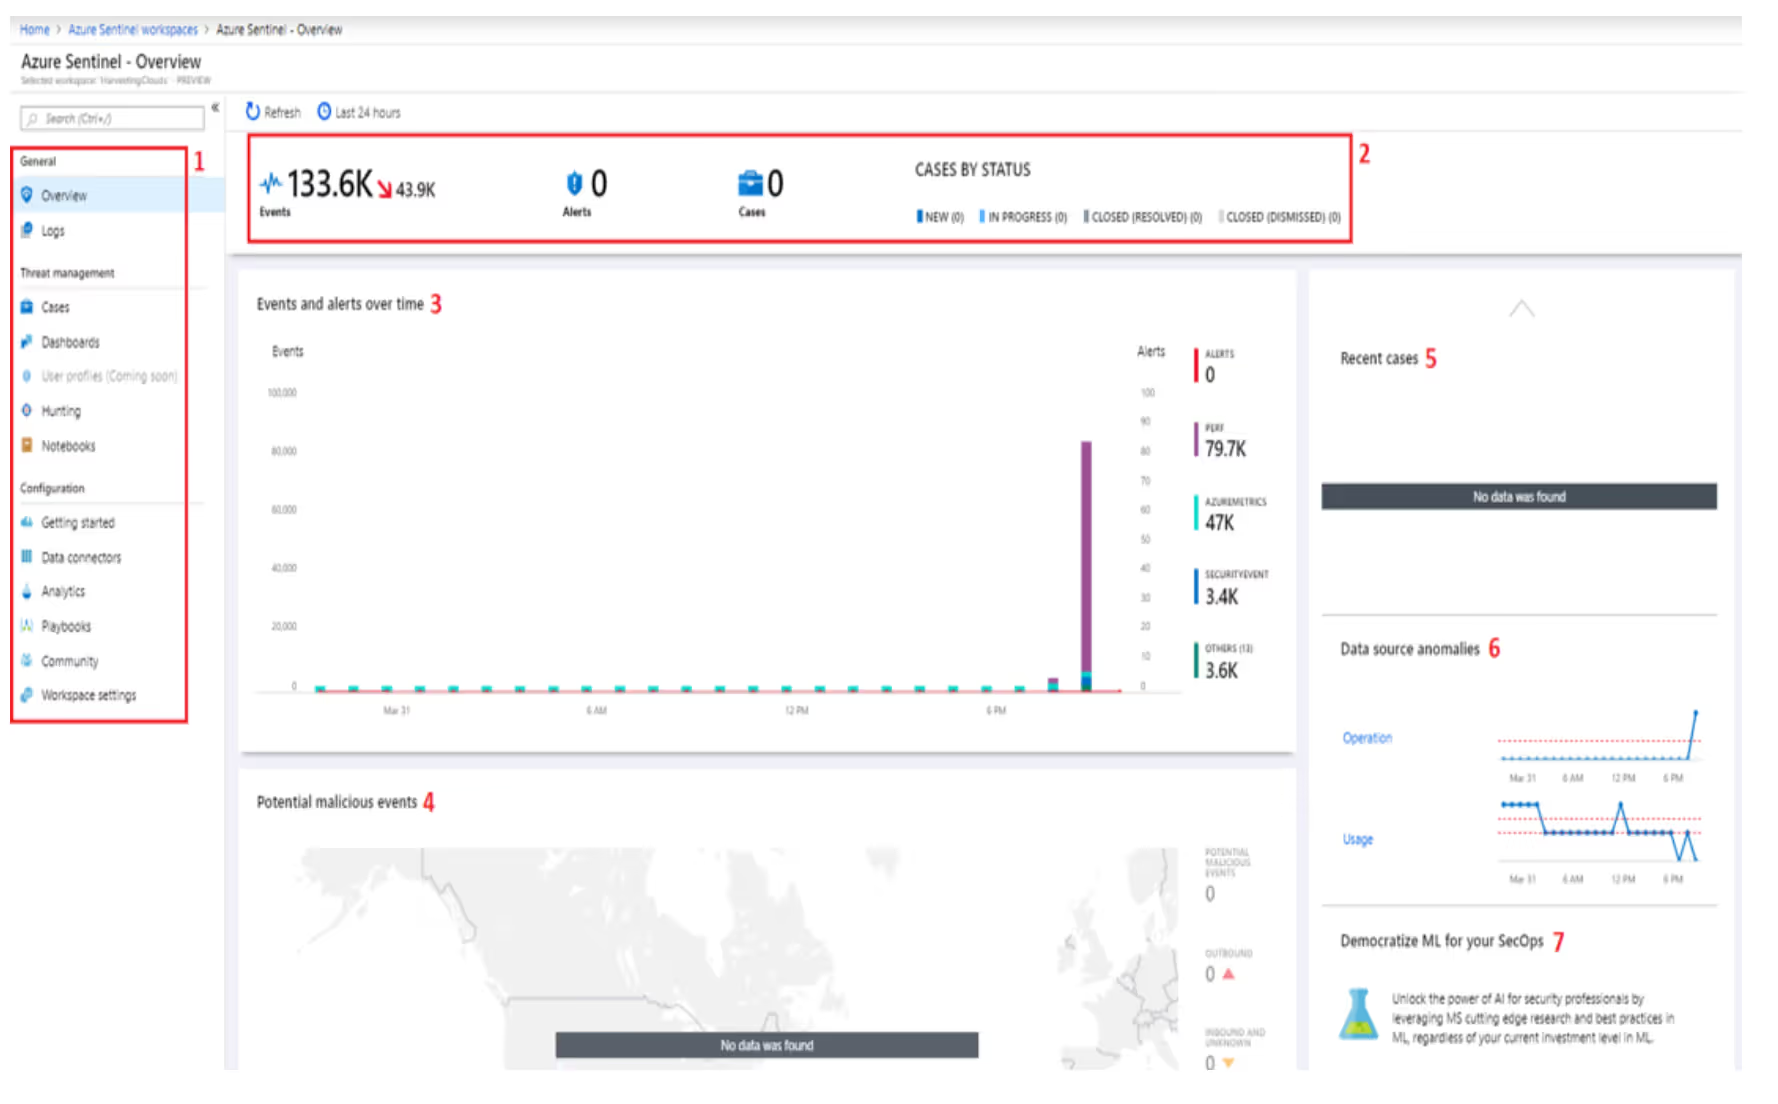
Let's look at these parts in little more detail:
In the second part of this Sentinel blog series, we will delve deeper into Azure Sentinel features.
[Update] Ready to get more advanced with Sentinel? Read Part Two to explore automation, machine learning, and more features.
